


The Skytek system is important to the Columbus module for three fundamental reasons. It ensures the safety of our astronauts, enhances the efficiency in which they carry out procedures and its use of XML technology will represent a cost-saving for ground personnel by making procedure changes easier to implement.
Skytek has decades of experience and a proven track record of developing software for the International Space Station. We look forward to working with Skytek as we send astronauts back to the Moon and beyond.
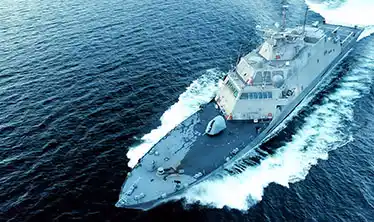
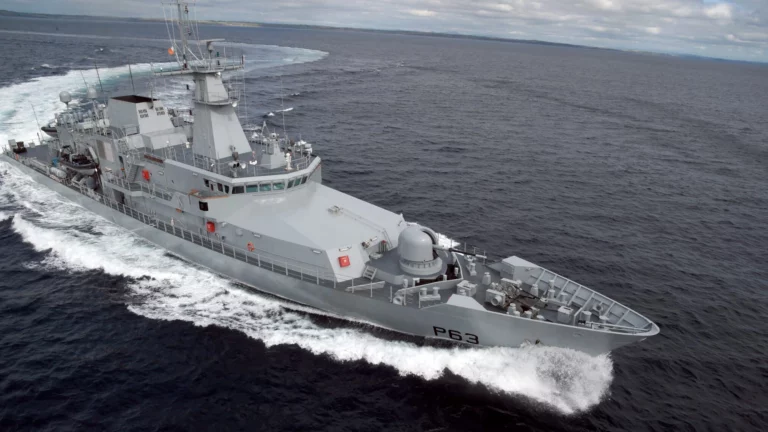
The Earth Observation and Intelligence reporting we receive from Skytek's Satellite Club allows us to regularly monitor the condition of the insured vessels we have in Ukrainian ports.
As part of Aon's commitment to Data & Analytics, this InsurTech partnership is focused on using innovative technologies to enhance risk management practices. As part of our development partnership, we will be taking analysis beyond cargo and marine hull aggregation to also weave in business intelligence functionality using clients' own data.
This is an excellent example of how space technology can benefit society. This technology has been rigorously tested under extreme situations for reliability. By harnessing these developments, huge leaps can be achieved in efficiency, safety and saving lives.
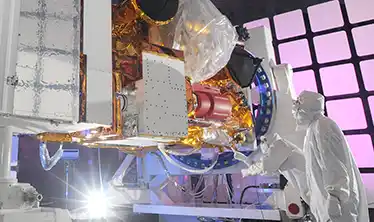
ICHEC is working with Irish technology company Skytek to provide an archive for the European Space Agency for Sentinel and other data. A portal will provide archived products, real-time data and on-demand processing for the public sector and commercial users in Ireland.
Following the ESA's support, it is rewarding to see a practical application of science to the insurance industry - and in turn, supporting re-insurers globally to have confidence in the protection of their assets.
The underwriting system developed by Skytek has become invaluable to our organisation. The software enhances our workflow and reduces the time and cost associated with complex claims handling.
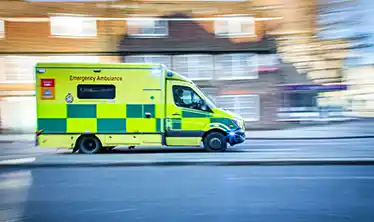
By equipping our crews with the latest technology, we can avoid delays and ensure that injured parties are getting the best possible care. This system means that our firefighters have access to key plans on their way to incidents and at the scene of accidents.